Case study · Product & Web
Making data
feel human.
Lumora helps small teams understand their numbers. We designed the product platform, a flexible design system and a marketing site that explains it all in seconds.
The challenge
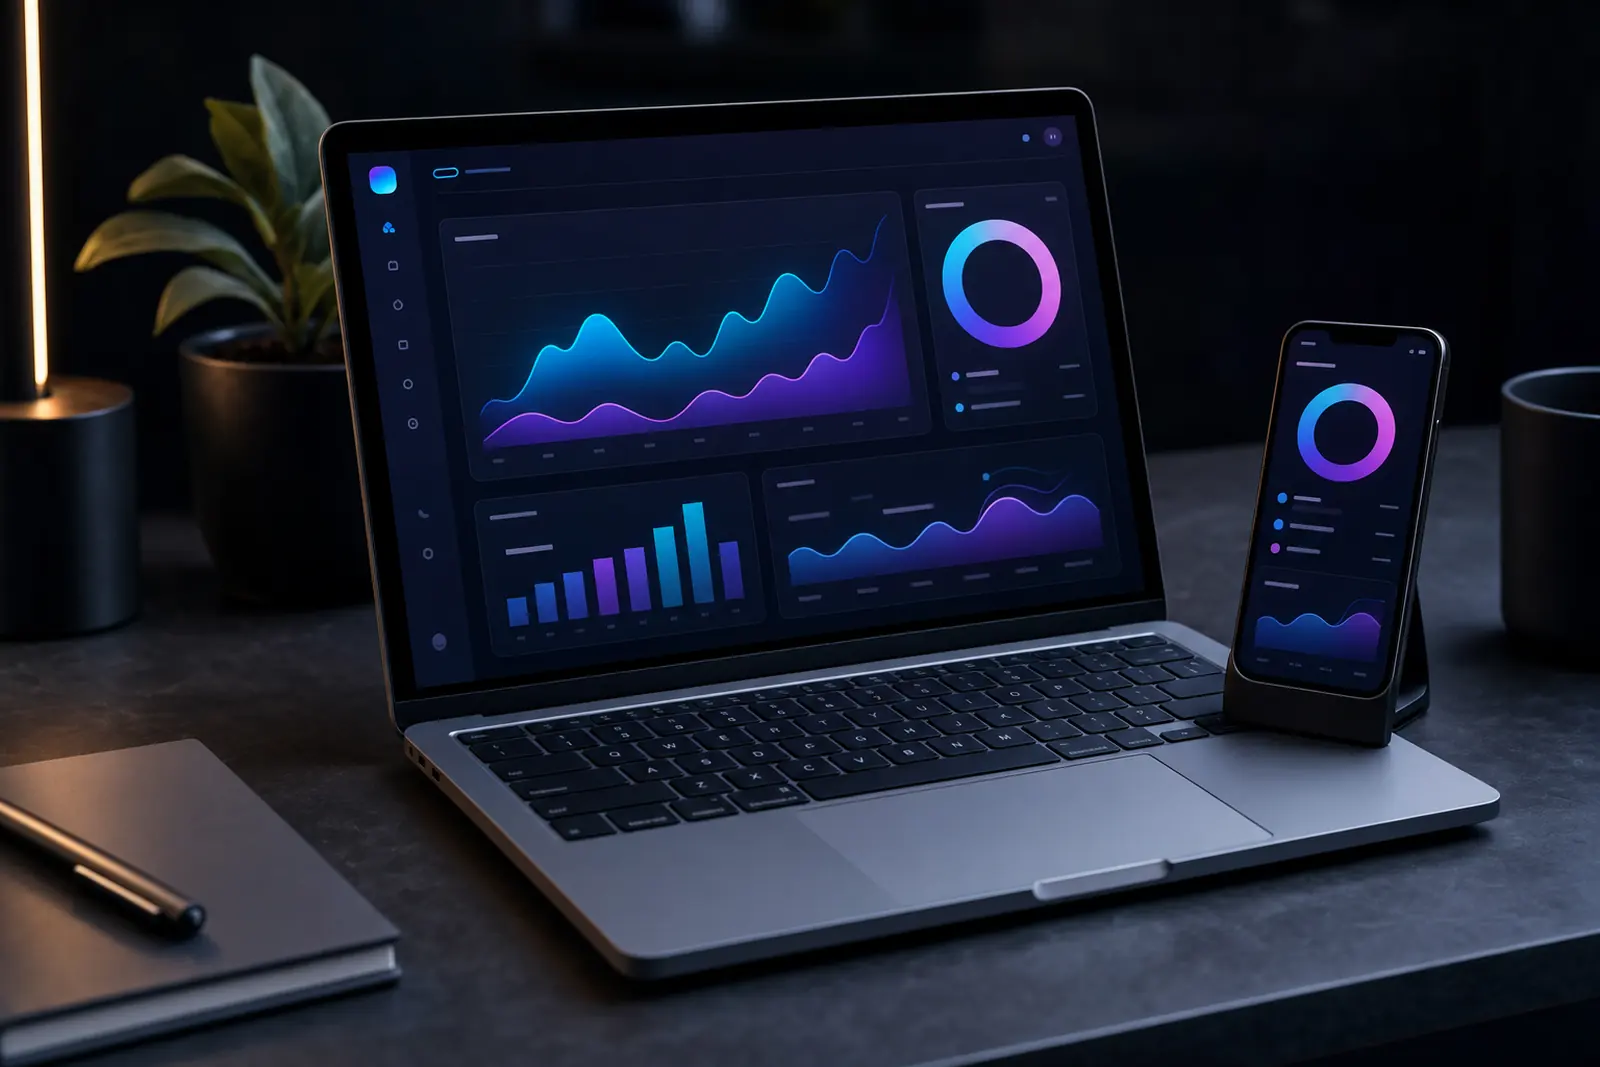
Lumora’s product was powerful but hard to explain. New users signed up, saw a wall of charts and left within minutes. The brand looked like every other analytics tool.
The goal: a calmer product, a distinctive look, and a website that turns curious visitors into trial users.
Our approach
We interviewed twelve customers, mapped the first-hour journey and rebuilt onboarding around one question: “What changed this week?”
- A new information architecture with three clear workspaces
- A design system of 60+ components with light and dark themes
- A marketing site with live, interactive product previews
- Motion guidelines so charts explain themselves as they load
Design system
Colour, type
and rhythm.
A small set of tokens drives every screen, chart and page — so the product and the website always feel like one thing.
Palette
Display type
Aa
Display 800 · Body 400–600 · Mono 500


Results
Numbers that
moved.
Measured over the first 90 days after launch, compared with the previous quarter.
They didn’t just redesign our website — they gave us a voice. Sign-ups doubled in the first month.